Fundamentals of Sound |
|
Fundamentals of Sound |
|
|
Perceptual attributes of acoustic waves |
|
PITCH |
| Definitions - Ranges - JND |
|
Pitch of Pure Tones Music Theory Primer - Tuning Perception Pitch & Frequency / Intensity / Duration |
| Pitch of Complex Tones Pitch & Spectrum - Analytic & Synthetic Listening Pitch Theories |
| The Octave Multidimensionality of Pitch: Pitch Height & Pitch Chroma |
|
Optional Section Pitch Theories |
|
Perceptual attributes of acoustic waves: Pitch Definition - Ranges - JND | |
| |
|
|
|
Listen to pairs of successive tones ranging from 440-441Hz to
440-448Hz. |
|
|
|
|
|
Pitch of Pure Tones |
|
|
C4-C4 C4-C#4 C4-D4 C4-D#4 C4-E4 C4-F4 C4-F#4 C4-G4 C4-G#4 C4-A4 C4-A#4 C4-B4 C4-C5
|
|
|
|
|
|
|
|
|
|
|
|
|
|
|
Pitch of Complex Tones Pitch & Spectrum - Analytic & Synthetic Listening
|
The dependence of the pitch of periodic complex tones (i.e. of complex tones with harmonic spectra) on frequency, intensity, duration, and the introduction of intense 'interference' tones is qualitatively similar to that of pure tones but more complex, due to the variety of frequencies involved. |
|
|
|
|
|
PITCH
THEORIES |
||
|
||
|
||
|
.
|
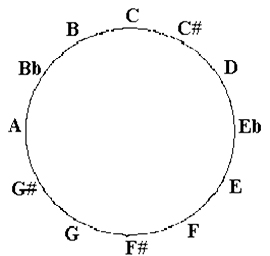
The Octave Multidimensionality of Pitch: Pitch Height & Pitch Chroma
|
|
|
The Octave or 8ve [ use this virtual piano to help you with the concepts in this section ] |
|
|
|
|
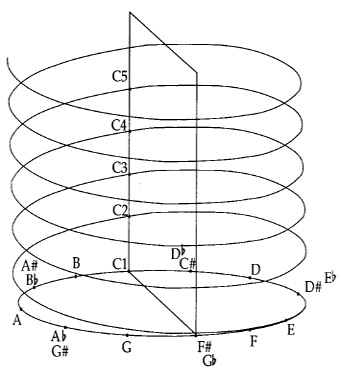
Multidimensionality of Pitch (pitch spiral)
|
|
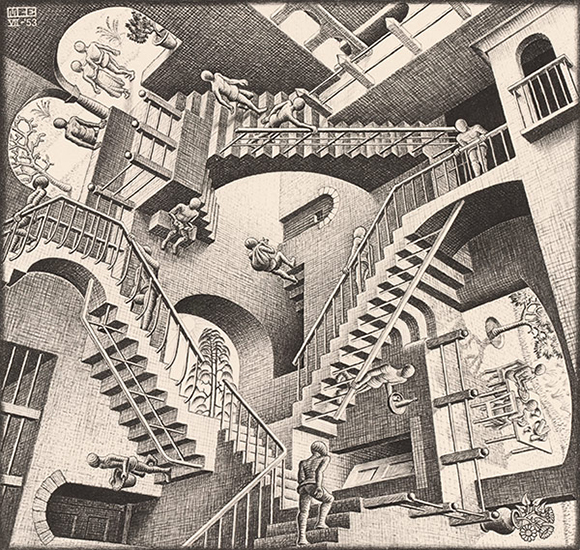
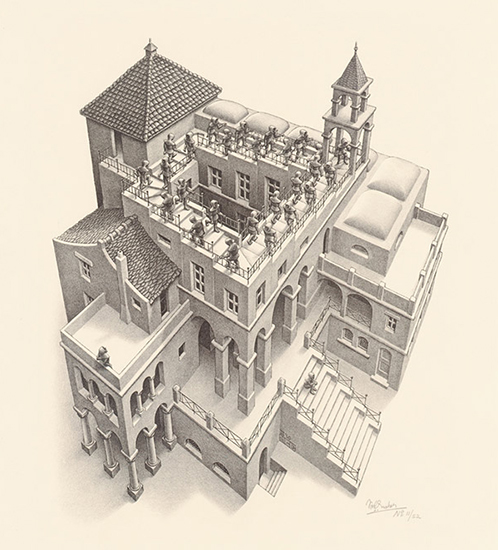 Relativity (Escher, 1953) Ascending-Decending (Escher, 1960) | |
| Short video on pitch and a/v related audio illusions | |
|
[OPTIONAL SECTION] |
|
| Place Theory of Pitch - Drawbacks | |
|
The Pitch-Shift Effects The first
pitch shift effect: The second
pitch shift effect: Vassilakis (1998) showed that these two effects are not distinct but alternative manifestations of a single phenomenon. In a follow-up work, he argued that the pitch shift effect reflects our perceptual system's handling of the interaction between the phase and group velocities of the inharmonic tone complexes used in pitch shift experiments (Vassilakis, 1998b).
|
|
|
|
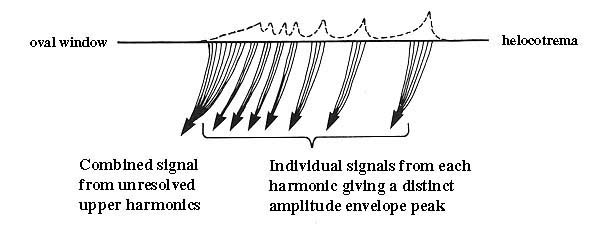
Unresolved Upper Harmonics
The place (or tonotopic) theory of pitch
requires energy in the lowest 5-8 components
(depending on fundamental frequency) in order to
produce a clear pitch sensation. The problem is that clear virtual pitch sensations persist even when the remaining components in a spectrum are not resolvable (see the 'unresolved upper harmonics' in the image to the left). |
|
|
|
Temporal Coding: Phase Locking and Rectification The "residue" theory is challenged by
the experimentally determined frequency region most
salient to pitch (~400-1500Hz) and has been reformulated
several times, |
|
|
|
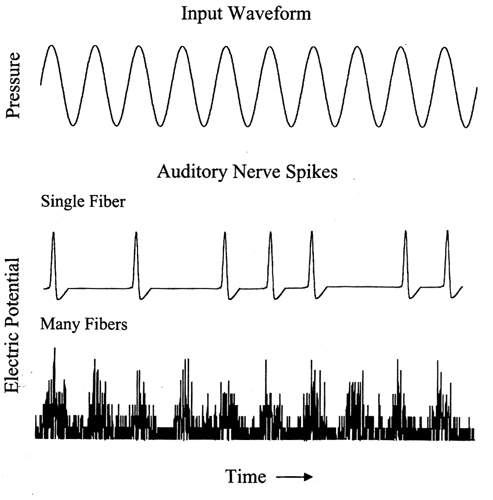
Neural response (neural firing) follows (or appears to be locked to) the positive peaks in the stimulus, firing only when the stereocilia are sheared in one direction.
This results in the neural signals of sinusoidal inputs The process of phase locking is closely related to hearing's "temporal coding theory" of encoding frequency information:
Since neurons are not fast enough to encode high frequencies, more than one neuron must be involved in the process. Each neuron fires at some of the peak portions of an incoming signal and, after adding the outputs of all neurons, the signal is represented to the brain in a manner similar to that shown at the bottom graph (left). |
|
Perception of pitch relations - Unit of pitch Mel: Pitch-height unit and scale devised by American psychologist S.S. Stevens (1937, 1940). It is based on 'twice as high' perceptual judgments. 'Twice as high' amounts to a larger musical interval at high registers than at low registers. Reference: 1000 mels = pitch of 1000Hz presented 40dB above threshold. The Mel unit of pitch height is analogous to the Sone unit of loudness. The derivation of the Mel scale has been criticized for flawed methodology and is not in use. |
 |
|
Further Resources
|
|
Key to the 3-tone
listening example:
DD (the tones have frequencies 12025Hz, 12000Hz, and
11975Hz, in this order)
Loyola Marymount University - School of Film & Television