|
Description of the 'Single Roughness' Results Page
Clicking on the 'Single Roughness' button will send your file to the application server
for analysis and take you to the 'Results' page. The results will include the
roughness value and spectral distribution (frequency and amplitude values by
descending amplitude) of the submitted file at the user-defined
point in time (default: file's mid-point),
and a list of the roughness contributions pair sine-pair within the signal's
spectrum. To
return from the 'Results' to the 'SRA' page, use the browser's 'Back'
button or hit the 'Backspace' key on the keyboard.
The analysis window length will be determined by the frequency resolution
setting (~320ms for 10Hz and ~160ms for 20Hz) and be centered at the
user-defined point in time. If the 'milliseconds' field is left blank, the analysis
window will be centered at the file's mid-point. The earliest (latest) point
within a file for which a roughness value can be calculated is 158ms (for 10Hz
frequency resolution; 79ms for 20Hz frequency resolution) from the beginning
(end) of the submitted file.
The degree of precision of the spectral analysis
(in terms of time, frequency, and amplitude estimates) is much finer than the
one required for roughness calculation (read about the
spectral analysis method). It captures fast, fine spectral time-variance
that does not necessarily correspond to perceivable roughness variations.
To reduce this effect, the (a) roughness value, (b) time value, and (c)
spectrum returned from analysis at
a requested time, reflect
a) the median of 5 roughness values calculated from 5 equally-spaced spectra
within an 100ms window (i.e. at -50ms, -25ms, 0ms, +25ms, and +50ms),
centered at the time requested,
b) the time corresponding to the reported roughness value (possibly different
from the
requested time), and
c) the spectrum used to calculate the reported roughness value.
The
sections below outline the segments of the 'Single Roughness' Results page
and include:
a) the roughness and time values returned from the analysis and a report of the
analysis parameters,
b) the spectral distribution (by descending amplitude) corresponding to the reported roughness, and
c) the roughness contribution per sine-pair in the submitted file's spectrum,
along with the relevant calculations.
ROUGHNESS VALUE AT THE REQUESTED TIME -
ANALYSIS PARAMETERS
 |
|
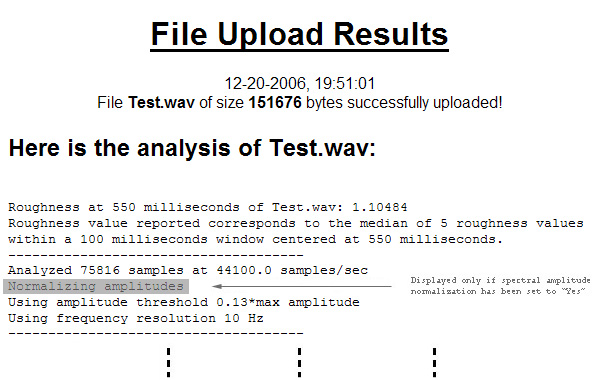
Figure 1: The results display the roughness value
calculated at the time requested (e.g. 550ms). If the time field had
been left blank, the roughness report would read: "Roughness at the middle
of ...". A statement on the roughness calculation's smoothening function is
followed by an outline of the file and analysis parameters. |
SPECTRAL DISTRIBUTION AT THE REQUESTED TIME
 |
|
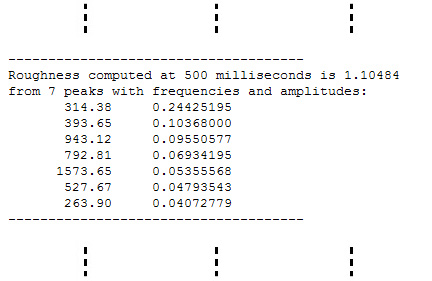
Figure 2: The spectral distribution consists of the frequency and amplitude values of up to
50
'peaks' (components) with amplitudes > the amplitude determined by the
amplitude threshold value, listed by descending amplitude. Regardless of the
decimal digits displayed, frequency and amplitude values are
estimated at 32-bit, floating-point precision. Note that the time indicated
in this portion of the results (e.g. 500ms, Figure 2) will not necessarily be the
same as the user-defined time, reported in the top portion of the results (e.g.
550ms, Figure 1). As already described, the roughness value reported at any given time
corresponds to the median of 5 roughness values calculated from 5
equally-spaced spectra within an 100ms window (i.e. at -50ms, -25ms,
0ms, +25ms, and +50ms), centered at the time requested. See the top of this
page for more. |
ROUGHNESS CONTRIBUTION PER SINE-PAIR
 |
|
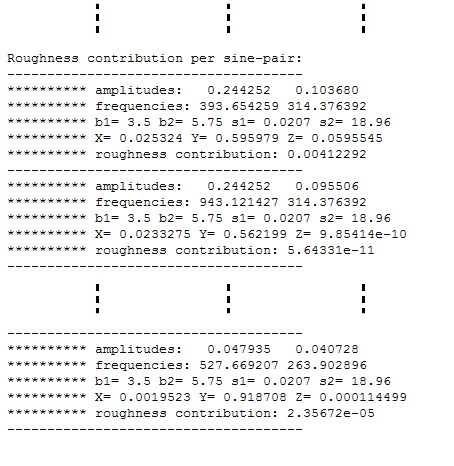
Figure 3: The roughness contribution of each sine-pair
includes the parameter
values of the model and the values for each of the 3 model terms (see the
model description).
The total roughness, reported at the top of the 'Results' page equals the
sum of all sine-pair contributions, scaled-up by a factor of 100, selected
to produce manageable roughness values. |
|