Fundamentals of Sound |
|
Fundamentals of Sound |
|
|
Perceptual attributes of acoustic waves |
LOUDNESS |
-
Loudness & Intensity |
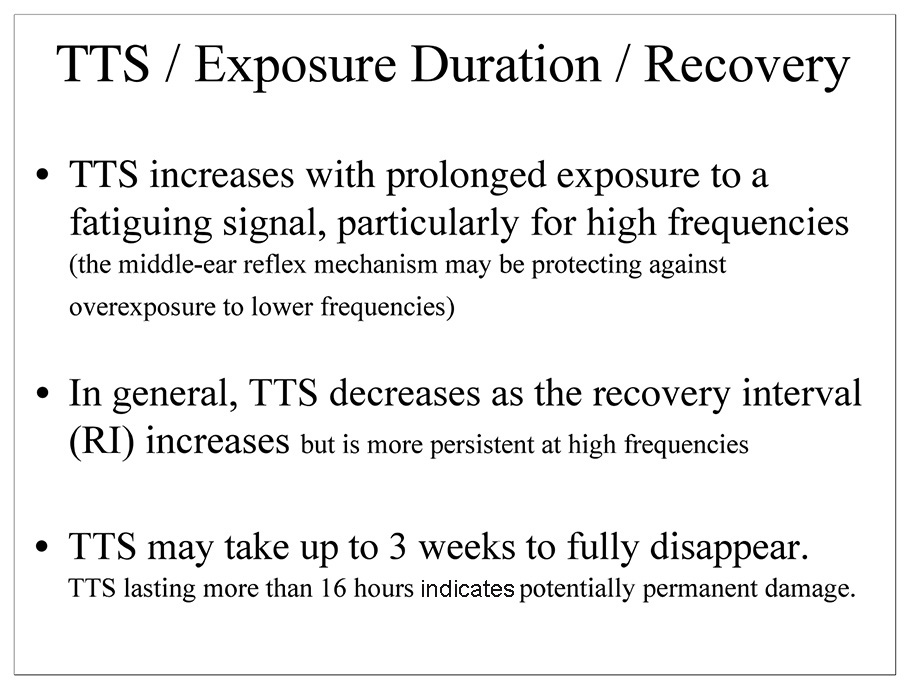
| Adaptation, Fatigue, & Temporary Threshold Shift (TTS) |
| Hearing Loss & Conservation |
Perceptual attributes of acoustic waves: Loudness |
Loudness: Sonic (i.e. perceptual) attribute of sound waves, related mainly to intensity. |
|
|
Loudness & Frequency / Loudness Scales
| |
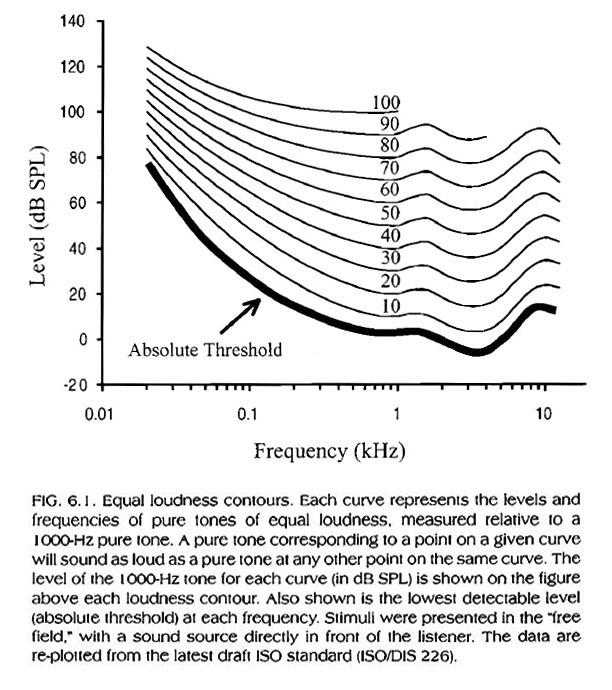
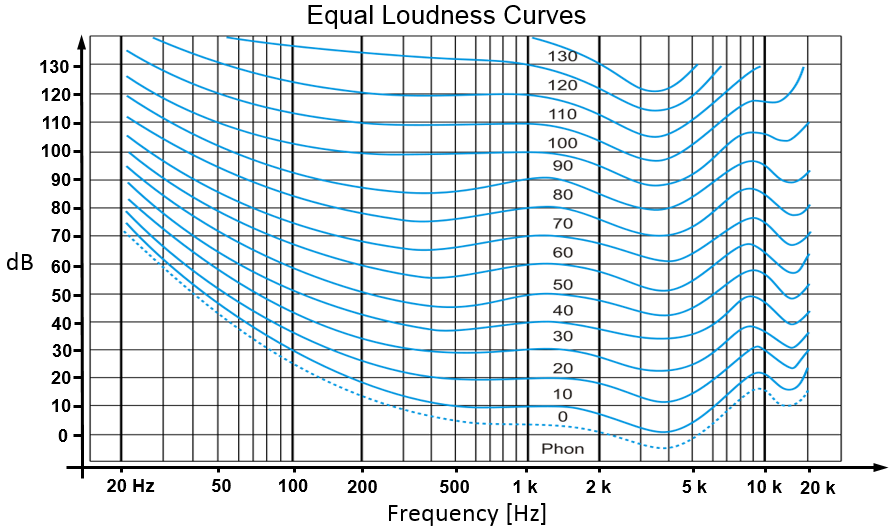 Equal loudness contours/curves for pure tones (after Fletcher and Munson, 1933)
For example (see above): | |
|
 |
|
|
|
|
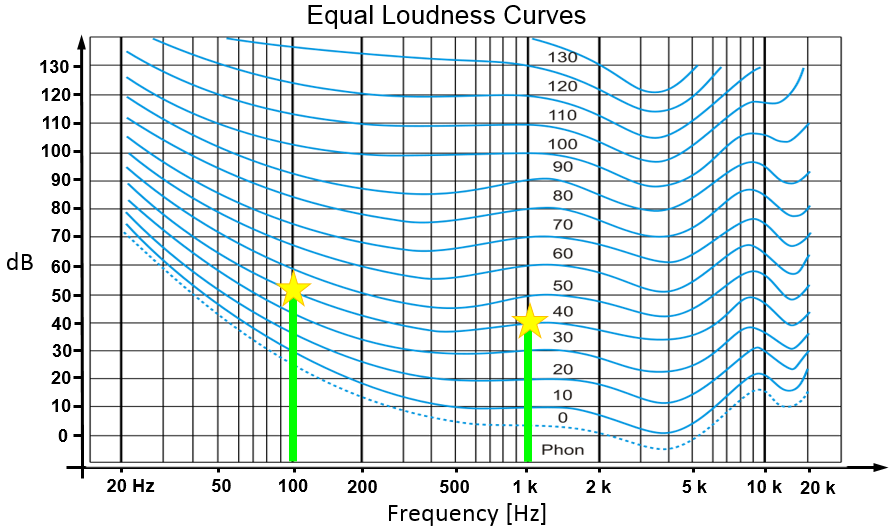
The A-weighting curve is the one most commonly used in
environmental noise assessments. |
|
|
|
|
|
Graphical depiction of the relationship between phons
and sones |
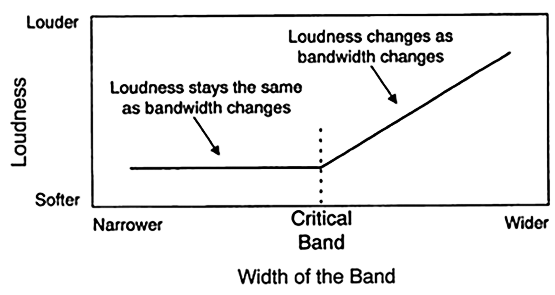
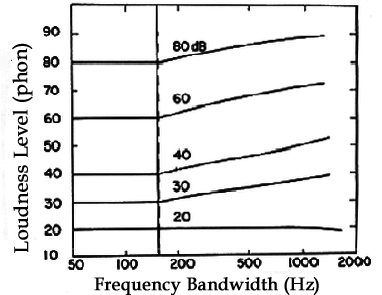
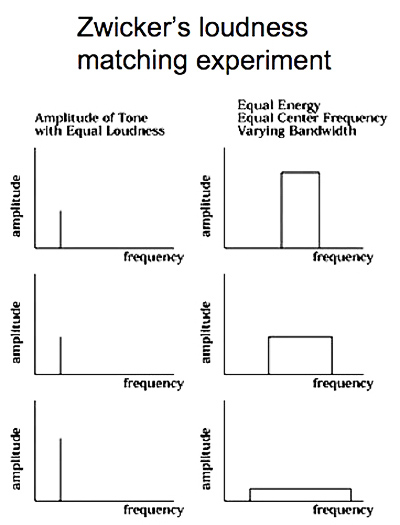
Loudness and Spectrum (bandwidth)
|
|
|
 |
|
| |
|
|
 |
|
SUMMARY
|
|
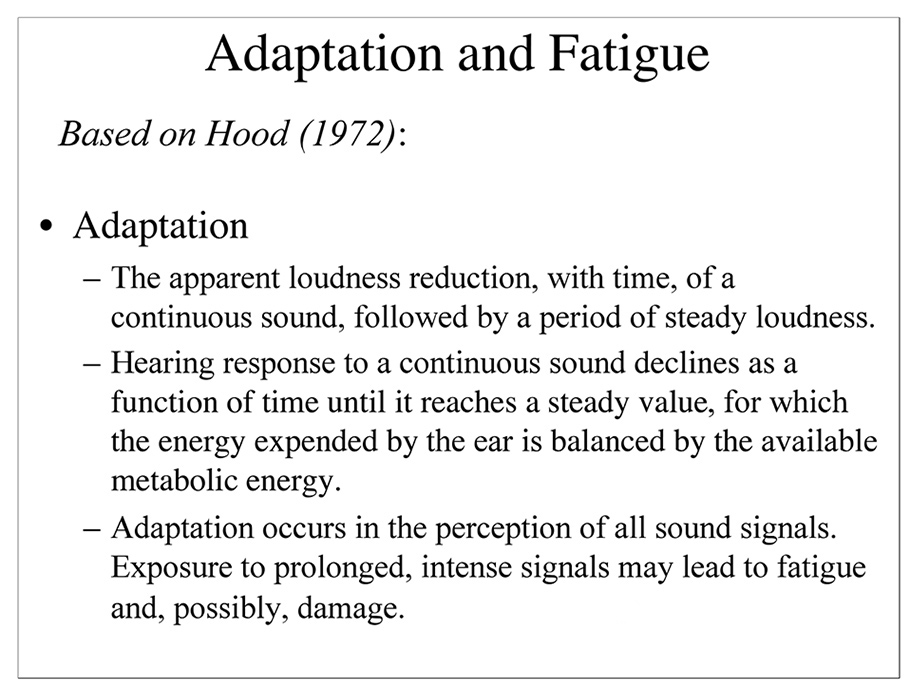
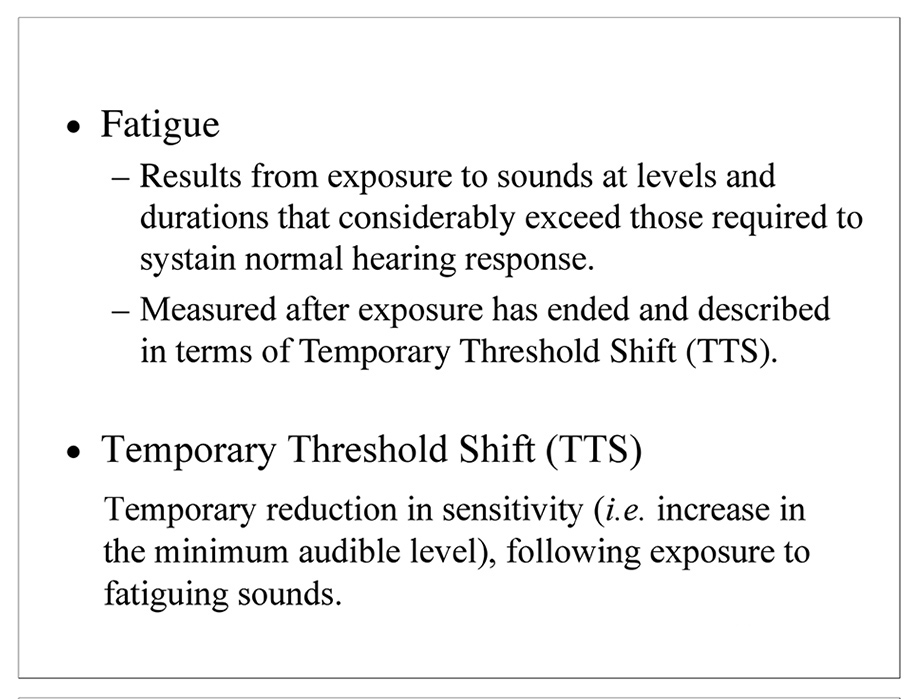
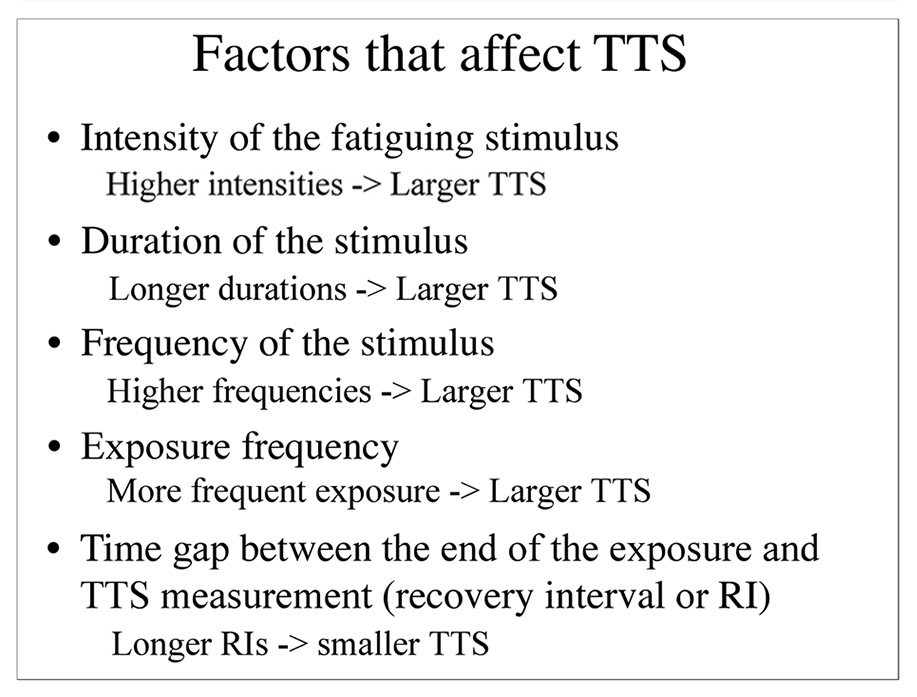
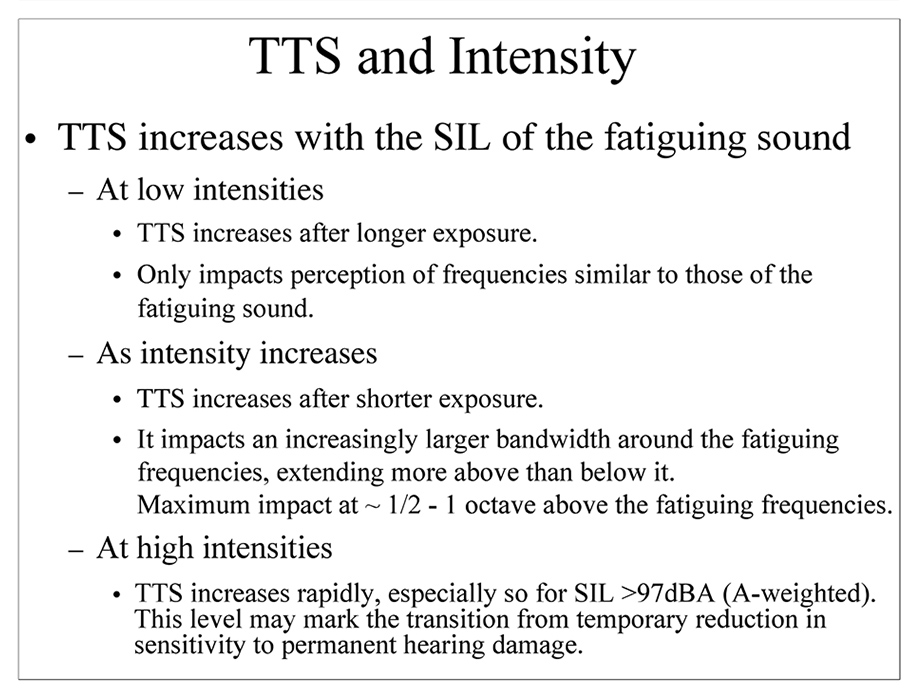
Adaptation, Fatigue, & Temporary Threshold Shift (TTS)
[
PDF Copy plus additional graphs ]
[ Print-Friendly Copy (4 slides/page) ]
|
|
|
|
|
.
|
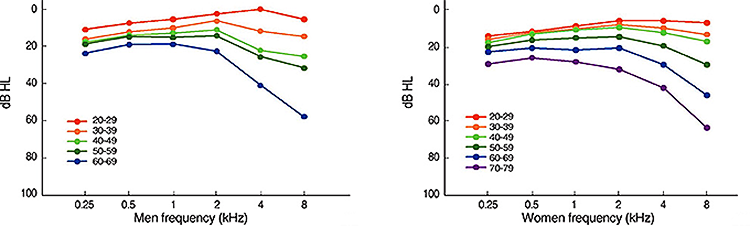
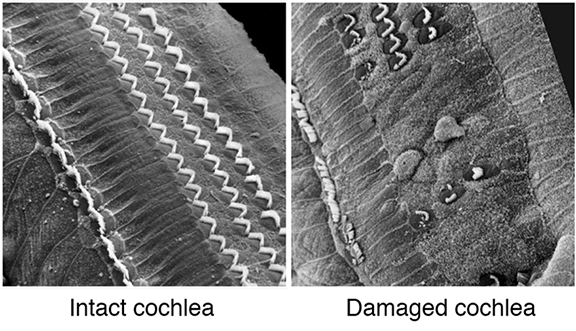
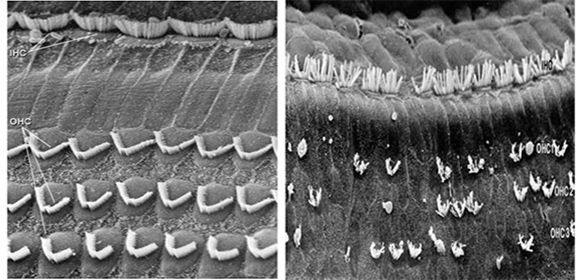
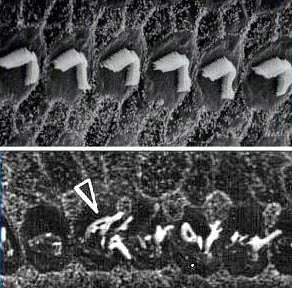
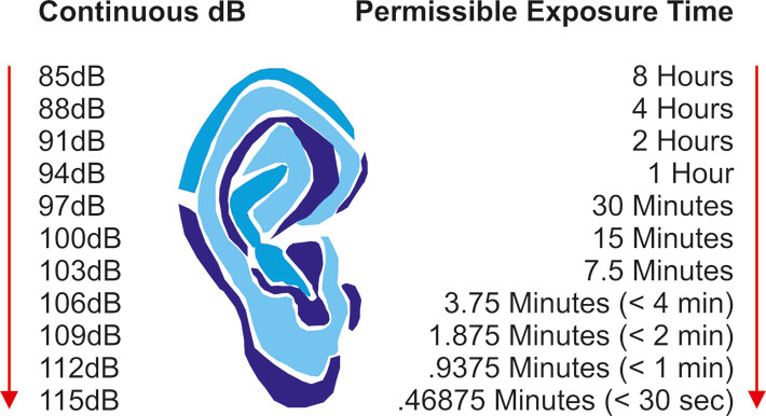
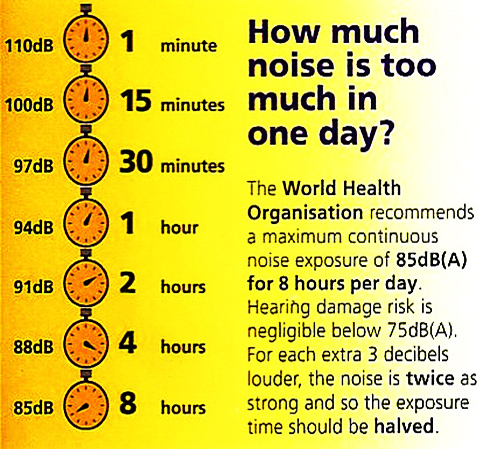
Music-induced hearing loss (MIHL) is caused by exposure to music at levels >85 dB (analogous to the sound of heavy city traffic) for prolonged periods of time. |
 |
|
|
|
|
Hearing Conservation Resources for Future Reference
|
|
Loyola Marymount University - School of Film & Television